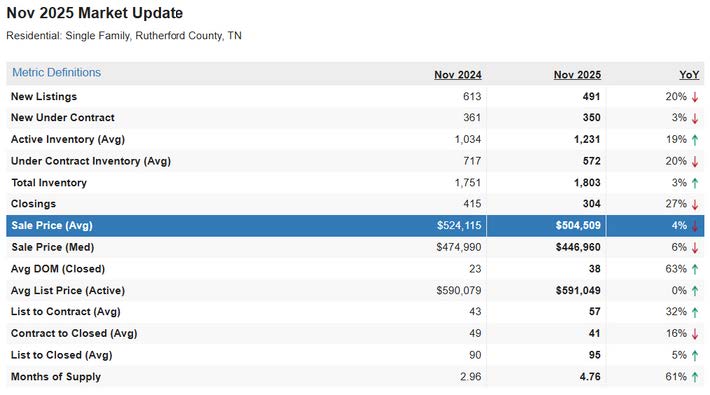
Time for the monthly update. This month we will compare November 2024 to November of 2025.
Everything listed below is comparing November 2024 to November 2025
-New Listings down 20%
-New Under contract down 1% (seasonal effect makes this not a drastic change)
-Active Inventory up 19%
-Under Contract Inventory down 20%
-Closings down 27%
-Sales price down 4%
-Days on Market up 65%
-Months of Supply up 62% to 4.81 months of supply (historical “even market” is 7 months)
One more interesting number is the total number of showings recorded through Realtracs. To me this is the most telling stat. This communicates intent or at least interest in making a move. The highest of the year was in August at 3807 total showings. It has steadily and sharply fallen off to 2830 in November. There is always some seasonality to this but it is a
sharp decline for sure. Couple this with the days on market and months supply skyrocketing AND the sharp decline in closings and new listings, and you have a market that is overall pulling back. Prices have no choice but to fall.
ALL of this news and even today, literally as I write this article, I am in the middle of a multiple offer situation where the buyers are bidding up a house. Y’all, it is crazy right now.