
| What deals can be had? This is truly an interesting market right now. We are finally seeing a very slight drop in the overall price level. It’s hard to see because of the way our system is set up for analytics. I will do my best to show you. I will also say that anecdote definitely supports the point. In addition to what I can show you in the graphs below, one area that unfortunately is not accurately tracked is seller concessions to buyers–closing costs, title expenses, home warranties and repairs. These are absolutely back in the market and very widely used. I would say that 80+% of the deals I am seeing have some kind of concession (besides commission) in them. This is great news for buyers and not the worst news for sellers. The harder news for sellers is the length of time it takes to sell. Days on market are still creeping up. In some submarkets–$550-$650k in Rutherford for example, DOM can easily top 60 days. This feels like an eternity when you are trying to sell in order to buy something else. But I digress. Let’s focus back on pricing. I said the overall price softening was somewhat hidden. Here’s why: |
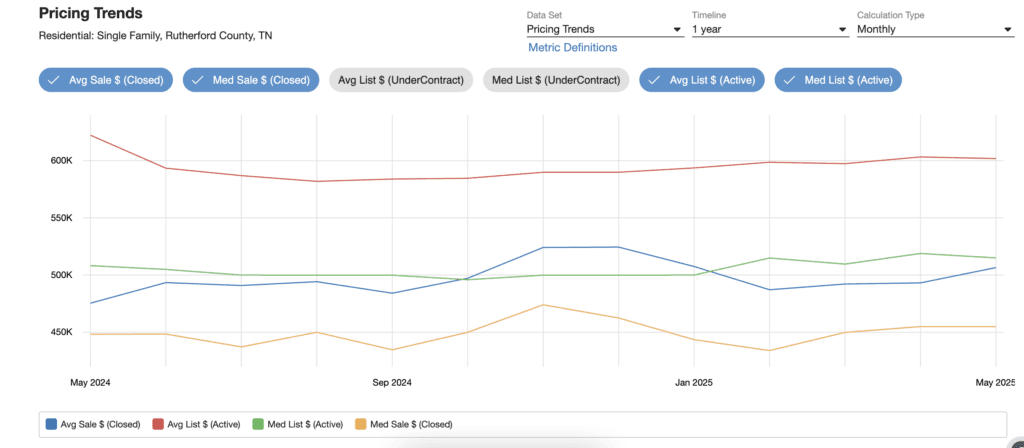
In this graph we see the average and median list price in the last year in Rutherford County and the average and median sales price. At first, you might think that the gap between list price and sales price is important. It is not as important as you might think. People are listing more houses than they are selling right now. We are building up inventory. We know this when we look at DOM and months supply of inventory–both are rising. What is important is the gap between average and median and how those in the list lines compare to the same in the sales lines. In other words, the average list price is much higher than the median list price and the average sales price is also higher than the median sales price, but not as much higher than the gap in between the list price. Additionally, the list price lines are higher than the sales price lines. This means a couple of things. First, list prices have a heavy skew on the high side, thats why average list is so much higher than median list. Second, sales price also have a skew to the high side but it is not as heavy as the list price nubmers. Second, the houses recorded in the sales lines are NOT always the same houses in the list lines. Days on Market and months supply support this. So what this means is that people drop their prices along the way and the house finally sells eventually. We are also seeing multiple offers come in on some lower priced homes the day they are listed. Both of these facts make up the bulk of the difference in the two sets of trend lines. There is some impact from larger price drops, but those usually occur after a home has been listed for a while. Let’s quantify what that looks like.
Screen Shot 2025-06-30 at 9.39.57 PM.png
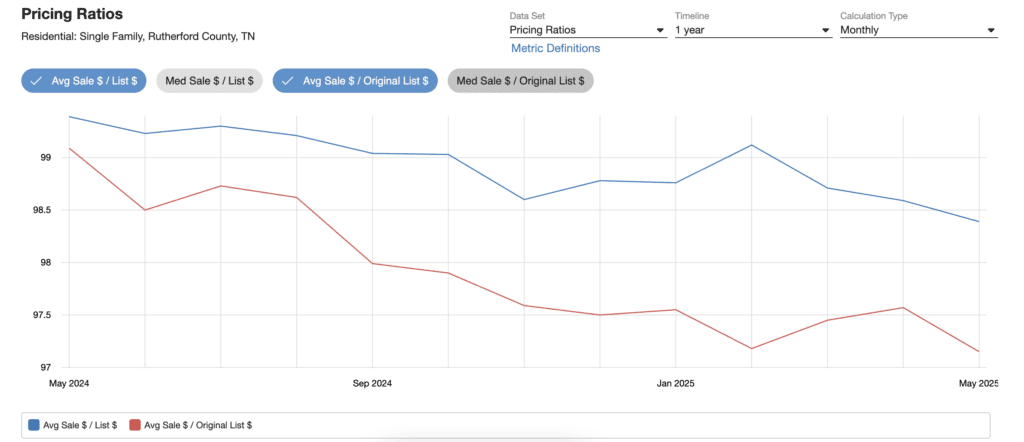
And this is the part that drives the previous point home. The blue line shows average sales price compared to the list price when the house went under contract. You can see it has been trending downward from very close to 100% to now around 98.4% (in one year!!). But look at the red line. That is average sales price compared to ORIGINAL list price. A year ago it was above 99% and has since dropped quickly to almost 97%. This line captures the effects of price reductions AND negotiated price drops in a contract. It also captures situations where an agent just plain prices it wrong. Put numbers to it–if a house is listed for $600,000 and has a 3% price drop, it is now $582,000. That is the AVERAGE. Compare that to the median (sorry, failed to get on this graph) at 99.4% and you see that half of all sales get better than 99% on their original list price. Outliers on the high side drag this down to almost 97%. That’s HUGE! It is also important to note that our sample size is much smaller than 5 years ago. We went from 718 closings in June of 2020 vs. 454 in May of this year. This drop in activity gives much more weight to each outlier.
What does all this mean? Simple, you have to have realistic expectations. Sellers are going to have to be more flexible than they were 3-5 years ago. Buyers can get a better deal than they likely expect. BUT that is not 100% true all the time! Our market is somewhat fractured and is inconsistent. And don’t get me started on new construction. That is lumped into the above numbers (around 40% of the business right now is new builds–traditionally new only accounts for 25-30%). What it really means is that you need someone to help navigate this market. It means that “you gotta know when to hold’em and know when to fold’em.” Knowing what to do in each specific, unique transaction is paramount. Understanding that EVERY deal is specific and unique is paramount. And accepting that not all licensees are created equally is paramount. We have elements of every market trend from the past 20 years going on simultaneously right now. Which one– and the best practice associated with that one– describes your specific situation?
If you have questions, I’d love to get coffee with you. Information is free.